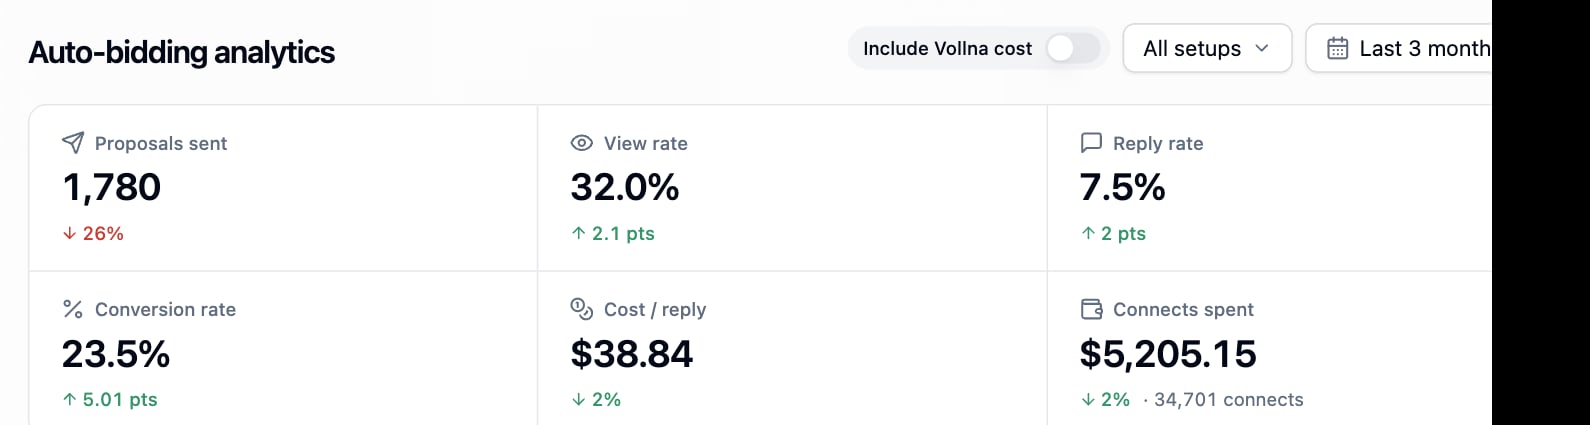
Open Auto-Bidding, then Analytics. The page counts auto-bidding proposals only, team-wide, by the date they were submitted. Every money figure is net of the connects Upwork returned. Invitations are excluded from sent, views and replies.

KPIs

KPI strip with proposals sent, view rate, reply rate, conversion rate, cost per reply and connects spent
Each KPI shows the change against the previous period of the same length. All time has no previous period.

Panels
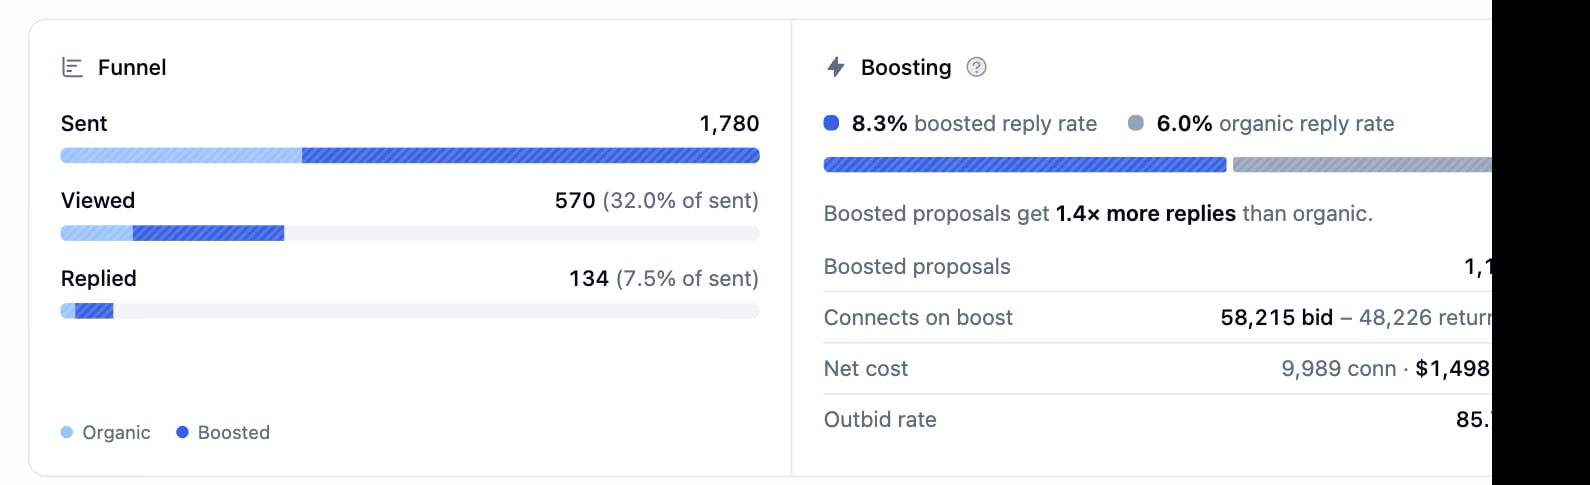
Funnel panel beside the boosting panel
Performance over time plots reply rate and view rate per setup. Switch between All proposals, Organic only and Boosted only. Funnel splits Sent, Viewed, Replied and Hired into organic and boosted. Boosting compares boosted and organic reply rates. Net cost is connects on boost minus the ones Upwork returned, times the connect price. Outbid rate is the share of boosted proposals that lost the auction. Setups gives the same numbers per setup, with cost per view and cost per reply.
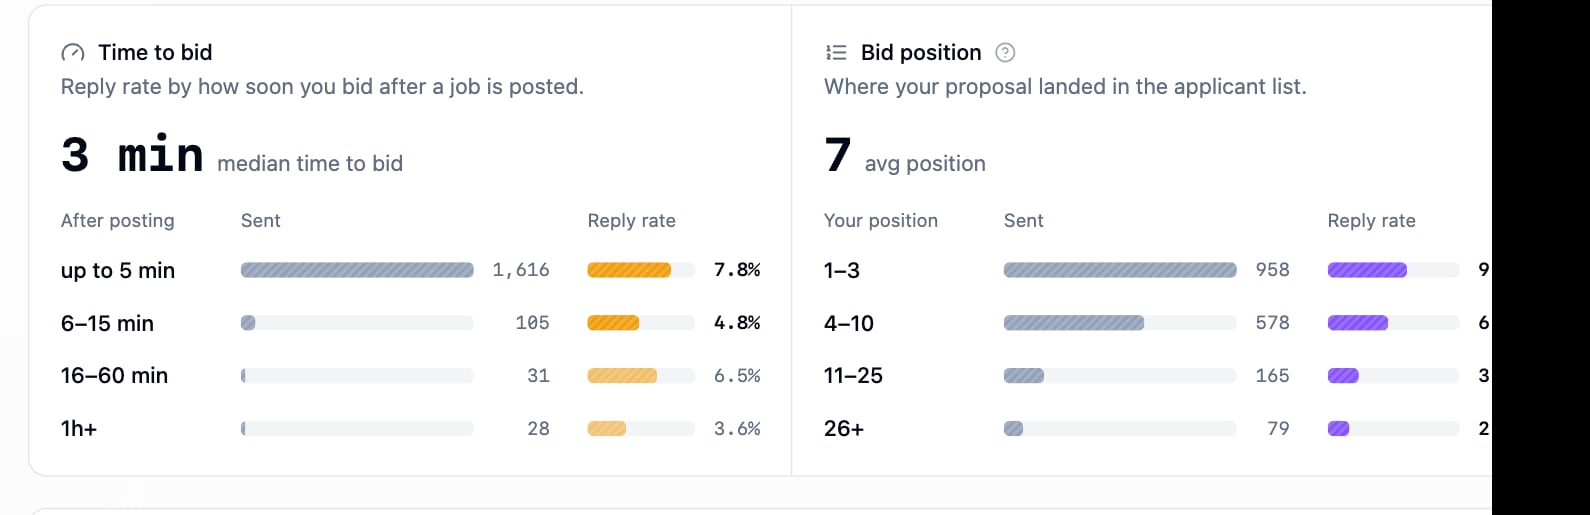
Time to bid and bid position panels
Time to bid is the reply rate by how soon the proposal went out after the job was posted. Bid position is the reply rate by where the proposal landed in the applicant list. Read them together: position depends on speed and on how busy the job is.
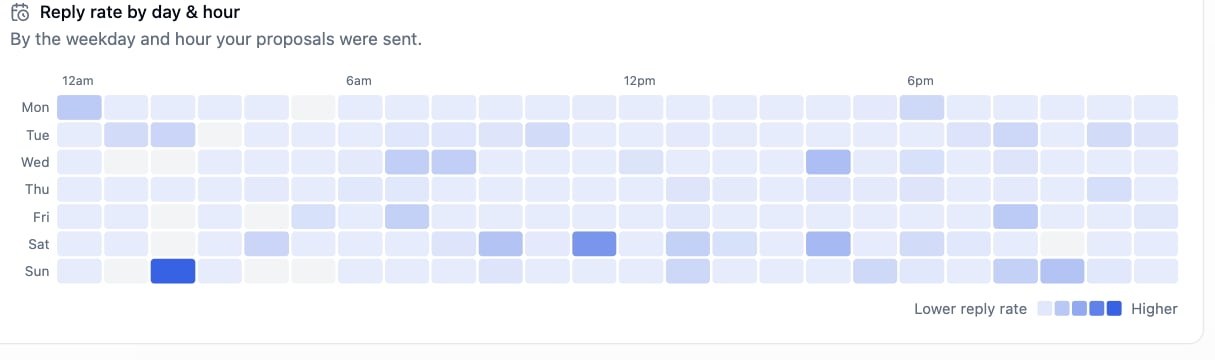
Reply rate heatmap by weekday and hour
Reply rate by day & hour uses the hour each proposal was sent. A cell stays empty until it holds at least three sent proposals.

A/B tests

A/B tests in the Auto-Bidding header lists every multi-template test across your setups.
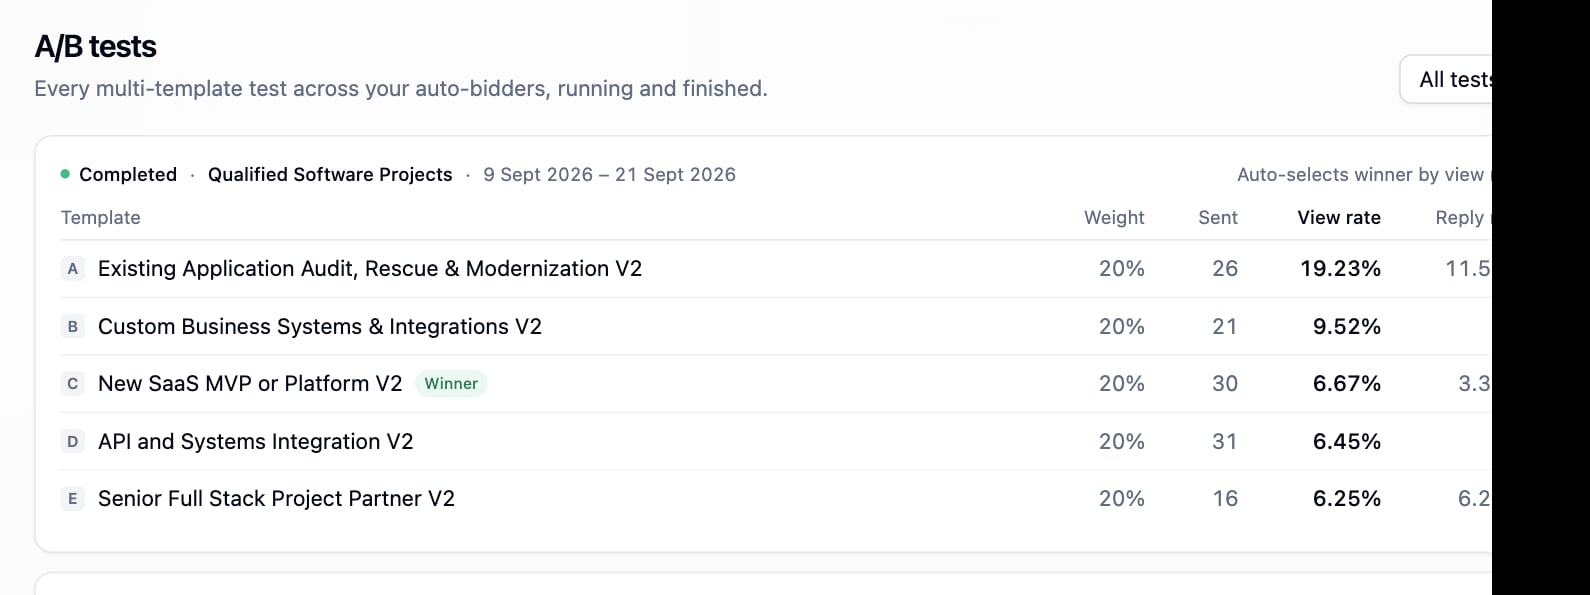
Completed A/B test card with the winning template marked
A finished test marks one row Winner. A test you stopped by hand marks the template you kept Kept. A running test shows live numbers and no winner. Set a test up on the setup.